在 VSCode 里边写代码边调试
最方便调试 nest 项目的方式
VSCode 实现了 Debugger 客户端
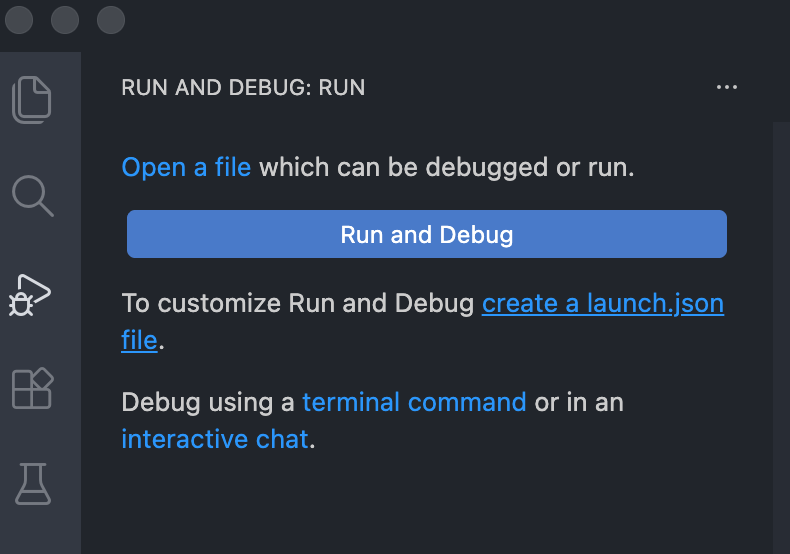
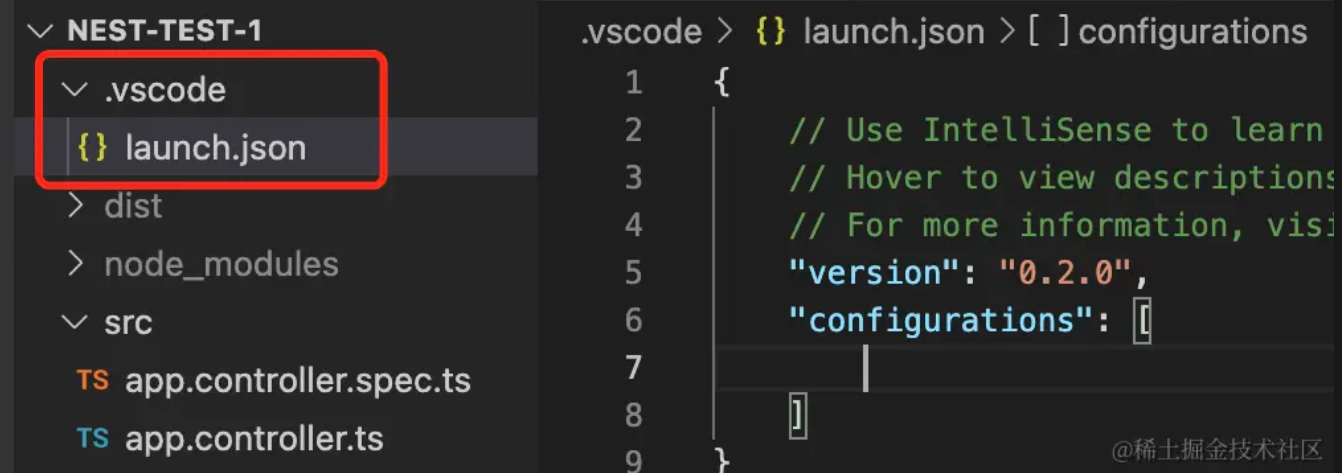
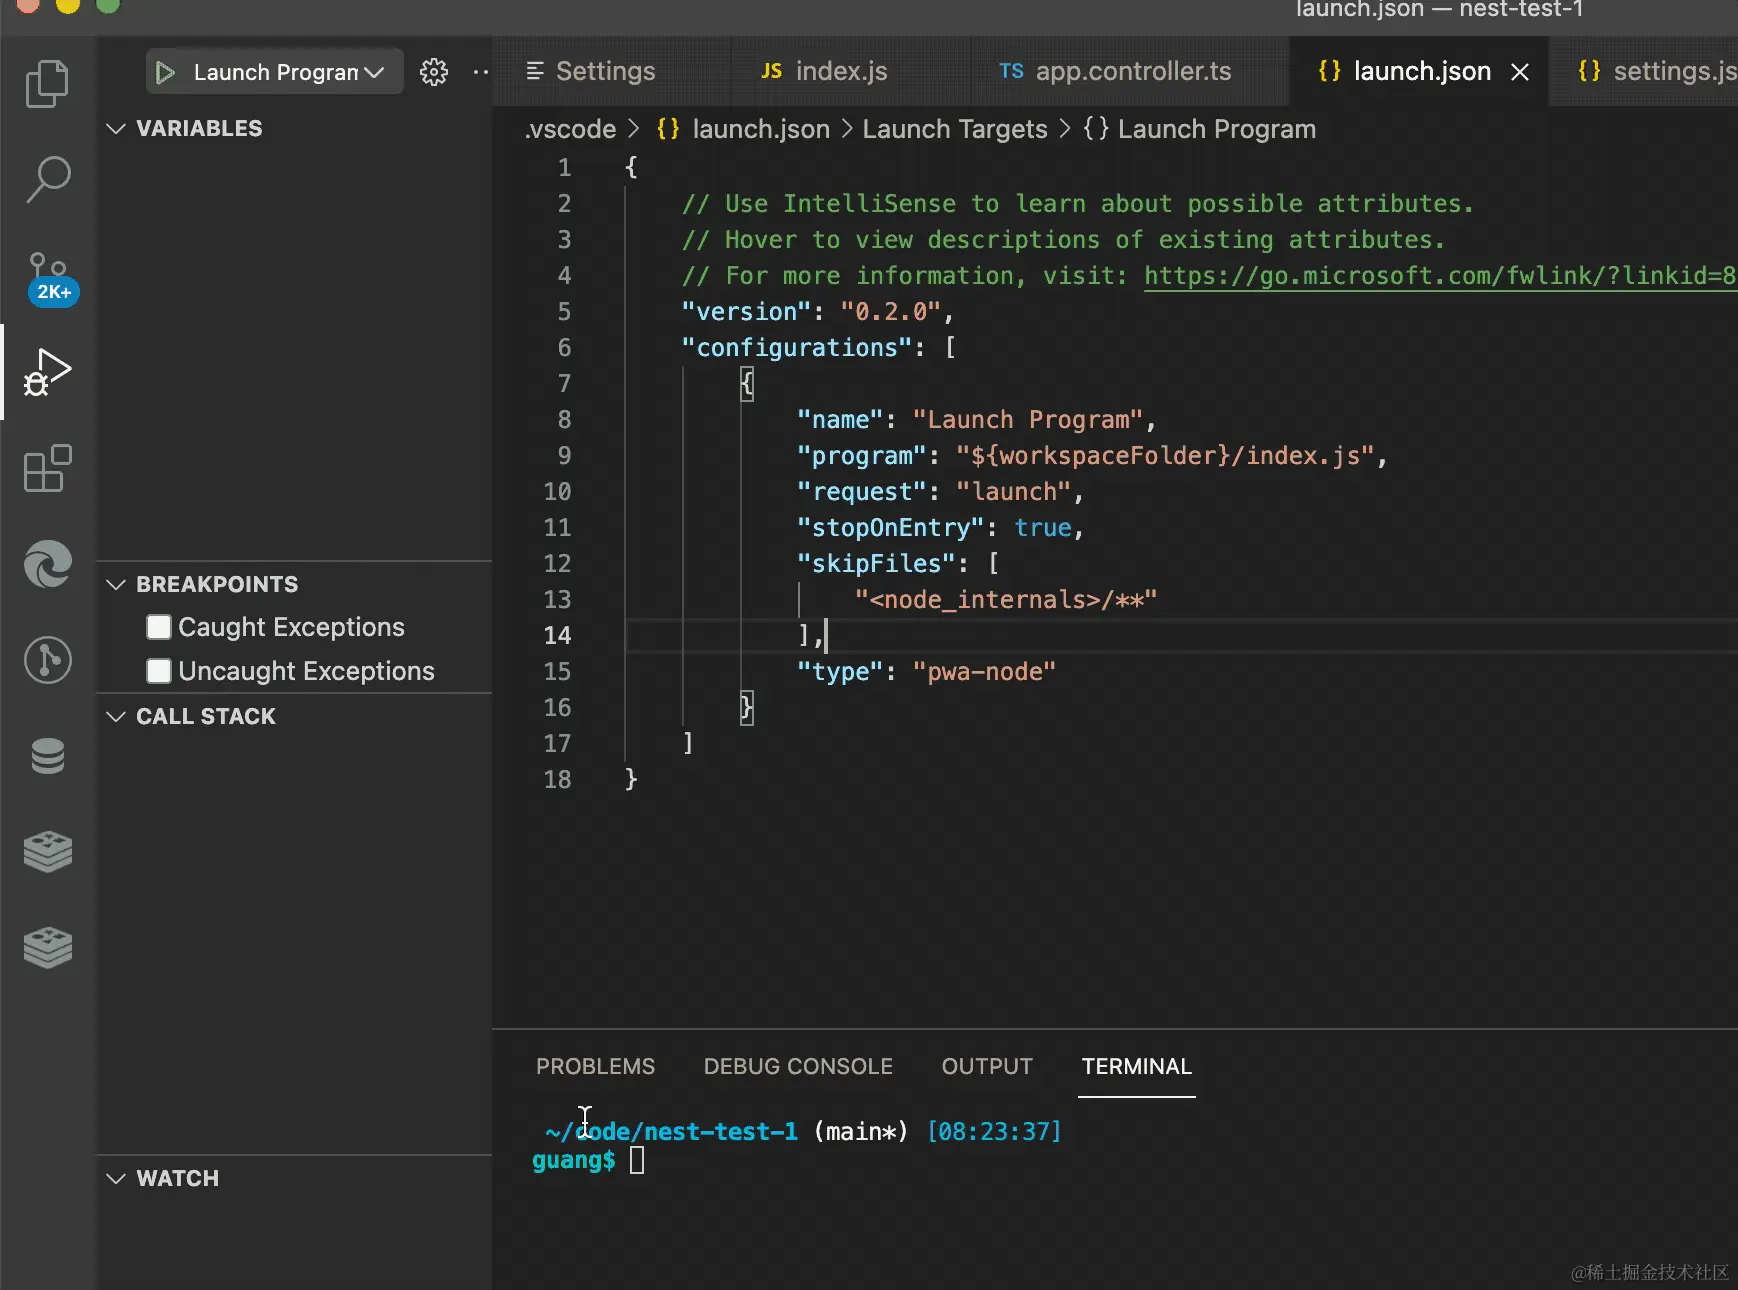
创建 .vscode/launch.json 文件
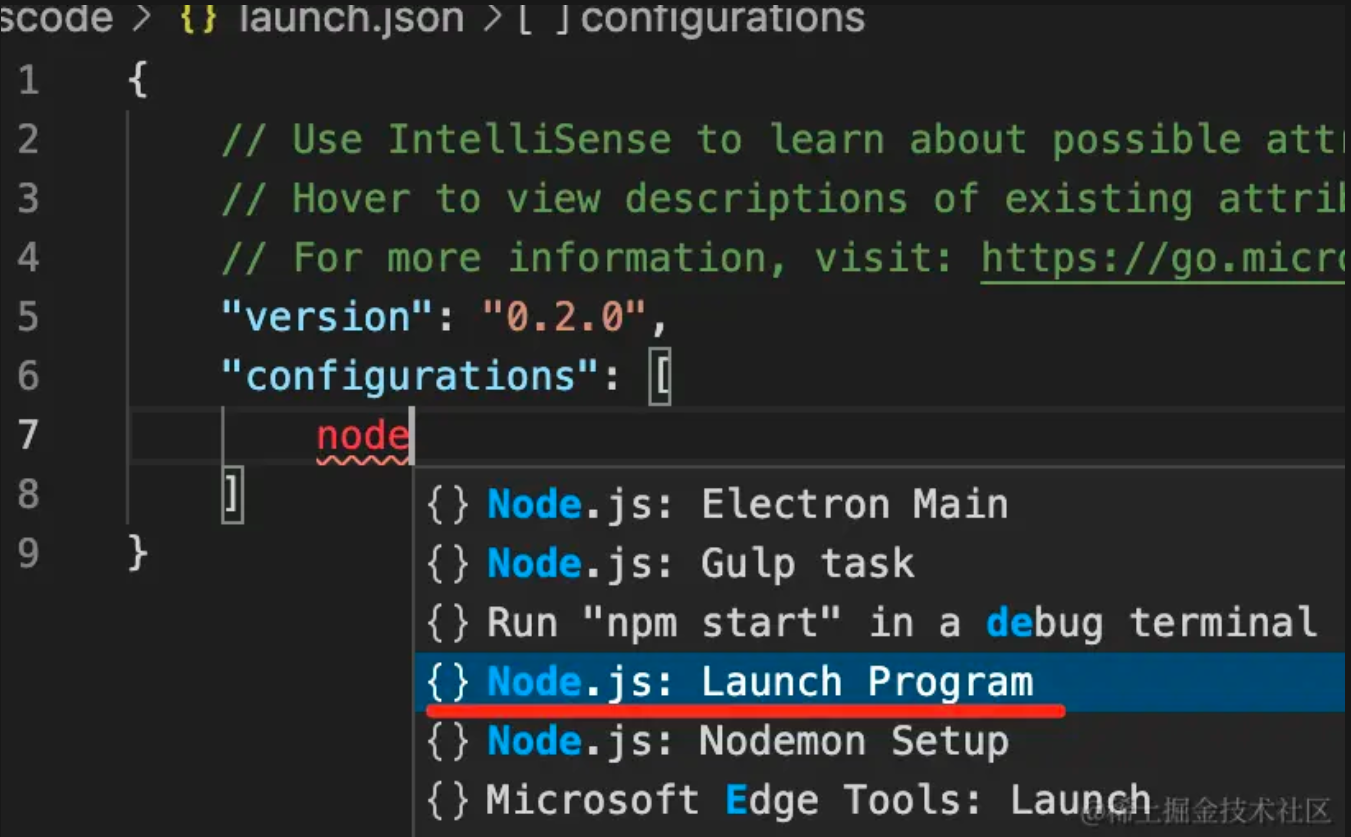
然后,输入node快速创建一个 node 调试配置
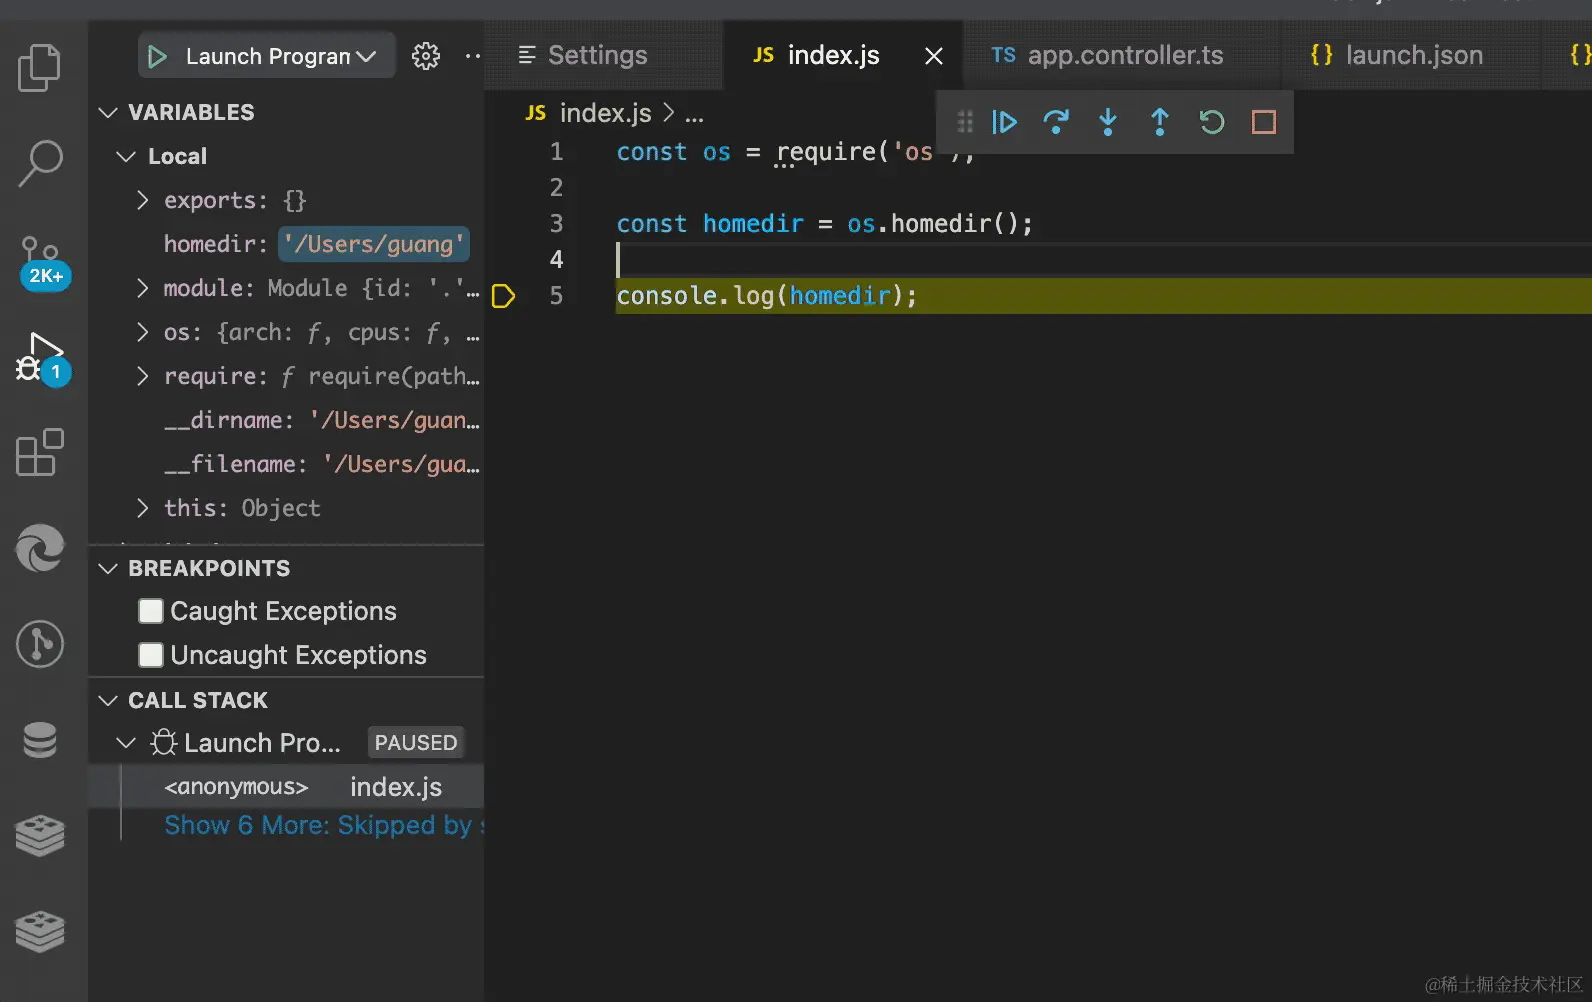
stopOnEntry 是在首行断住,和 –inspect-brk 一样的效果。
调试过程中修改了代码,点击重新调试,可以马上看到改动之后的效果
创建 nest scripts 的调试配置
.vscode/launch.json
1
2
3
4
5
6
7
8
9
10
11
12
13
14
15
16
17
18
{
  // Use IntelliSense to learn about possible attributes.
  // Hover to view descriptions of existing attributes.
  // For more information, visit: https://go.microsoft.com/fwlink/?linkid=830387
  "version": "0.2.0",
  "configurations": [
    {
      "name": "debug nest",
      "request": "launch",
      "type": "node",
      "runtimeExecutable": "npm",           // 执行什么命令
      "args": ["run", "start:dev"],         // 传递参数
      "skipFiles": ["<node_internals>/**"],
      "console": "integratedTerminal"。     // 用 vscode 内置终端来打印日志。默认用 debug console(没有颜色)
    }
  ]
}
和在命令行执行 npm run start:dev 效果一样
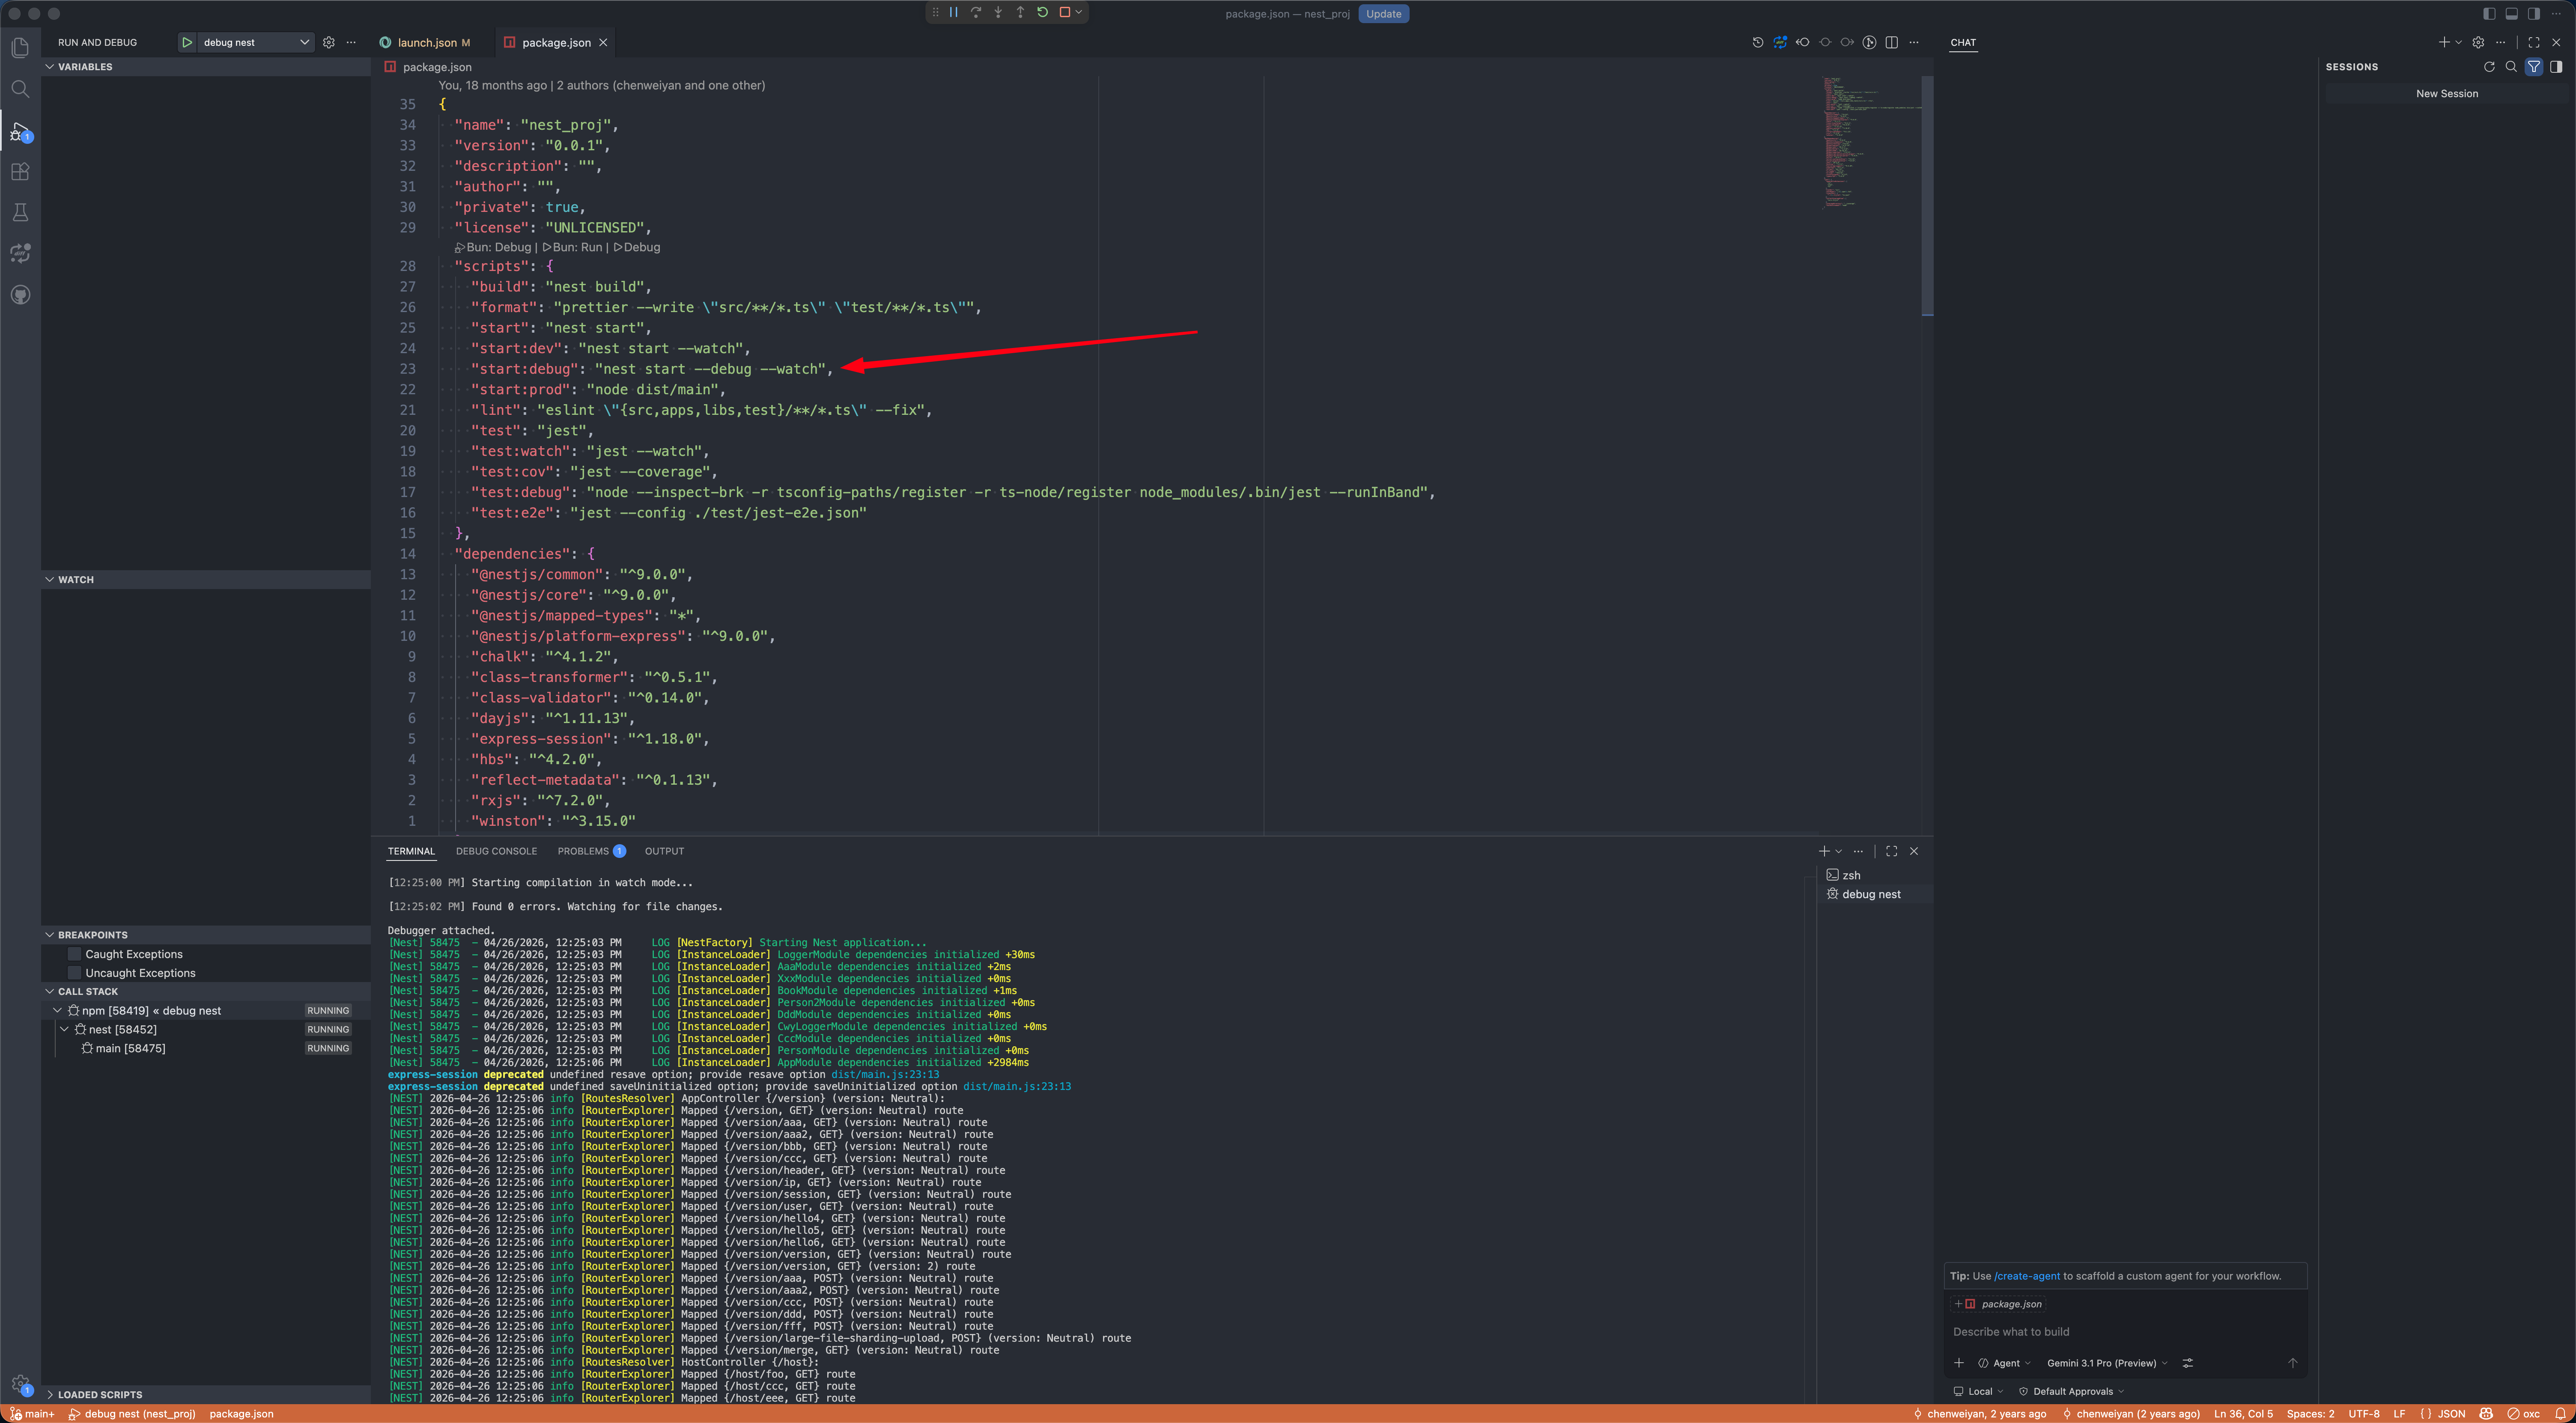
启动调试模式
然后浏览器访问 http://localhost:3000
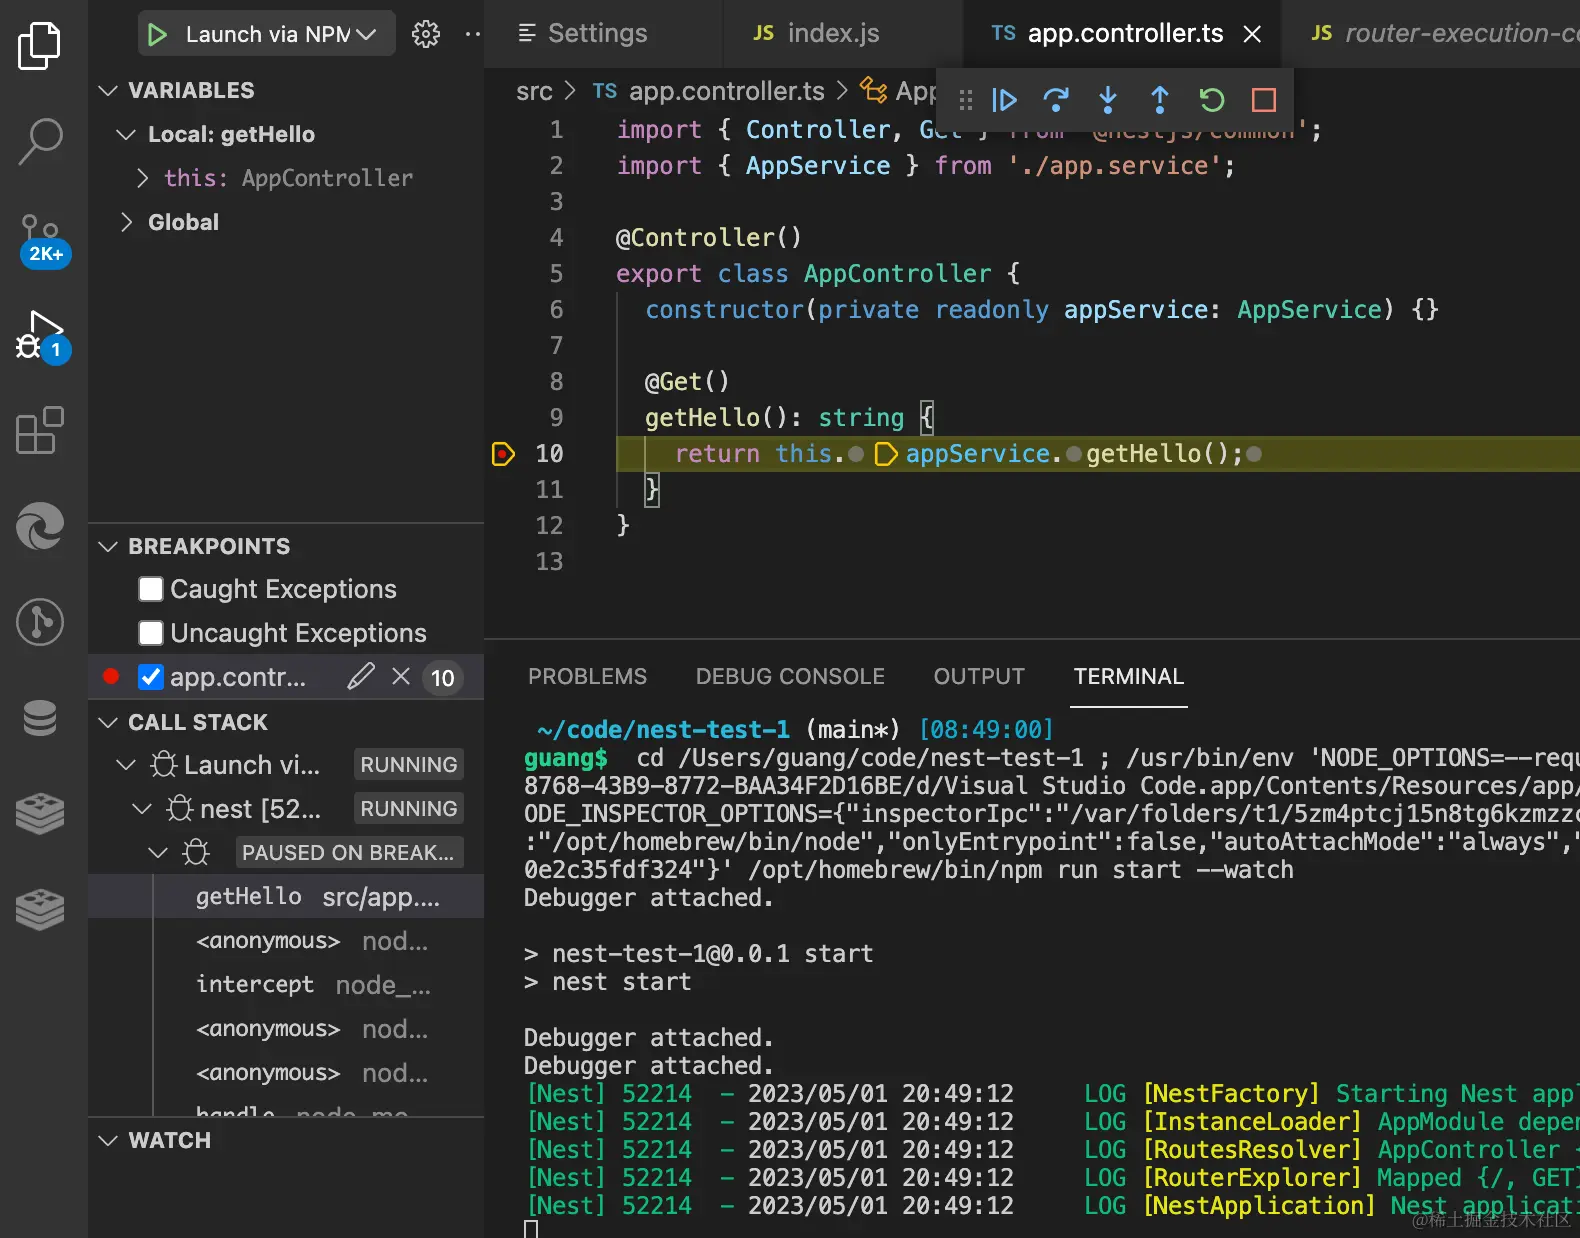
代码会在断点处断住
3个常用的断点类型
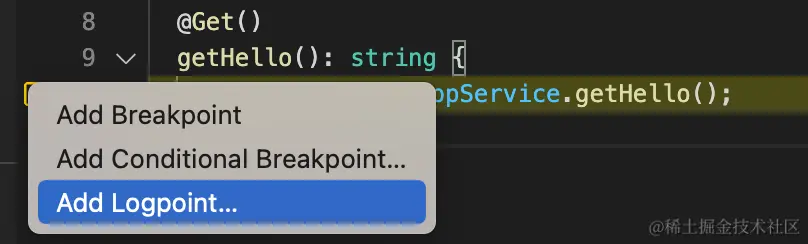
1.logpoint
只想打印日志,不想断住,不想加 console.log 污染代码,可以右键选择 logpoint
输入打印信息,变量用 {} 包住
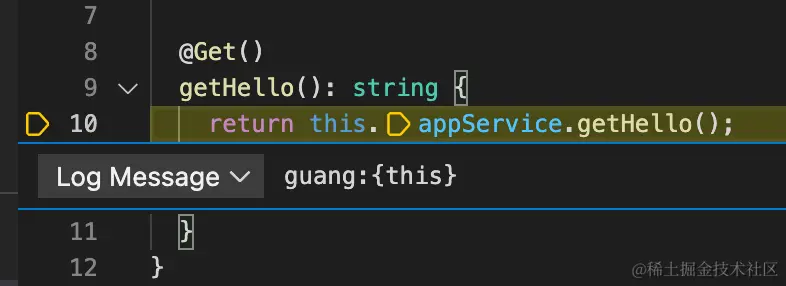
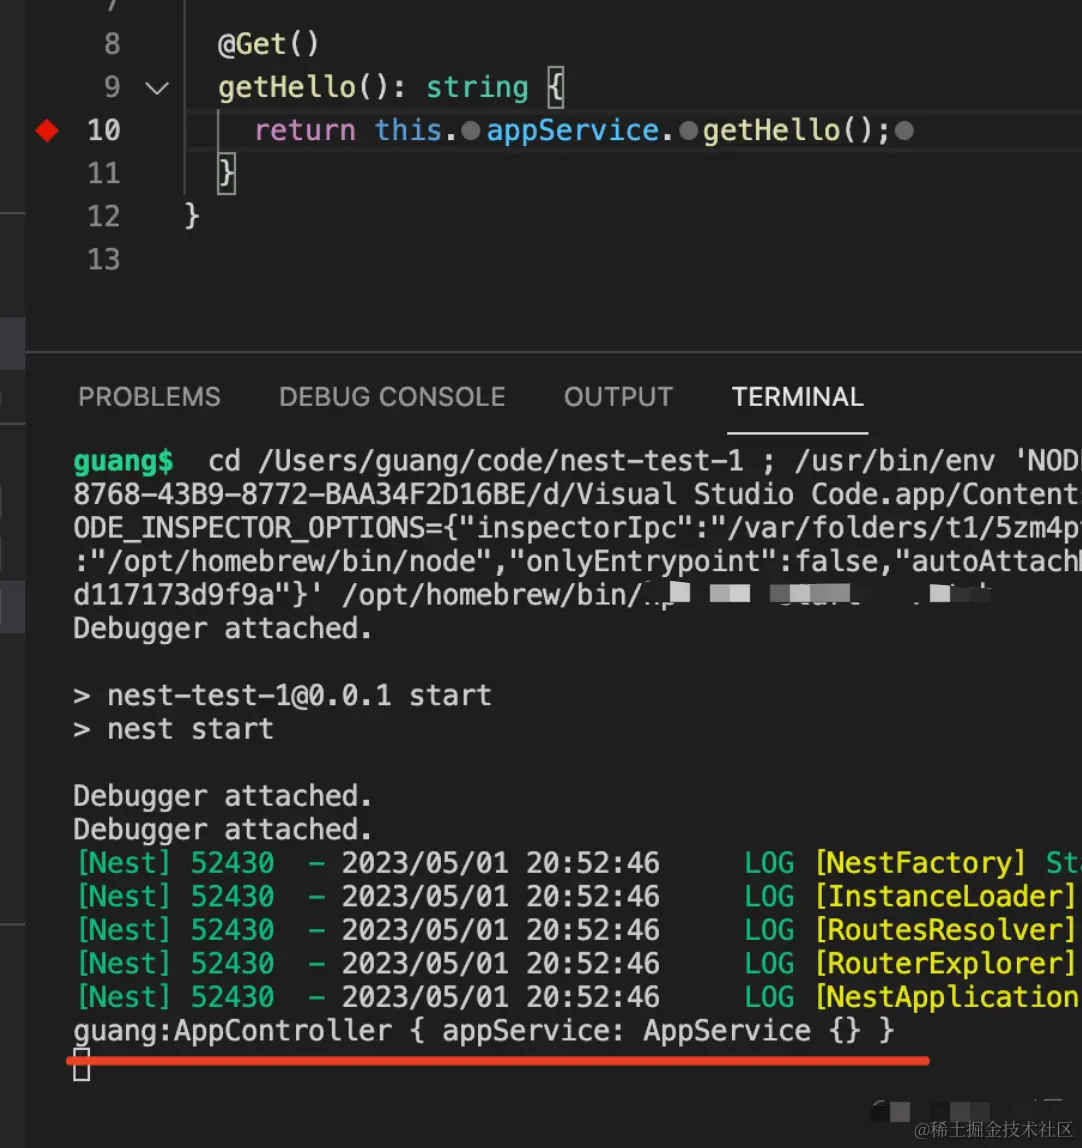
代码执行到这里就会打印
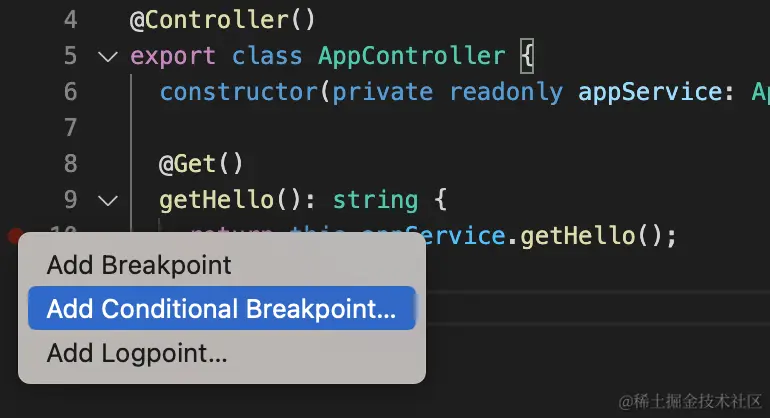
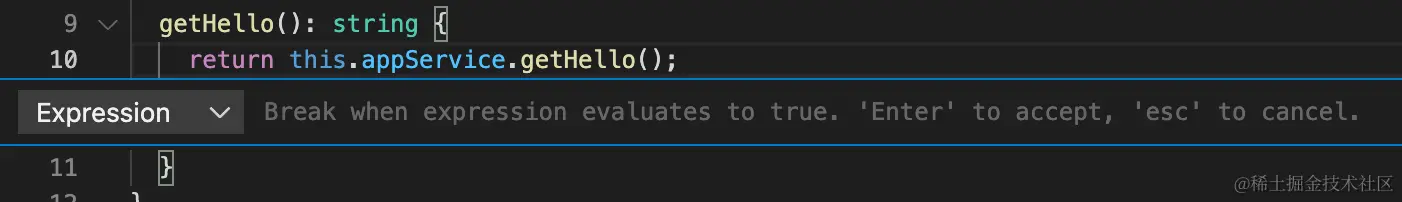
2.条件断点 Conditional Breakpoint
表达式成立才会断住
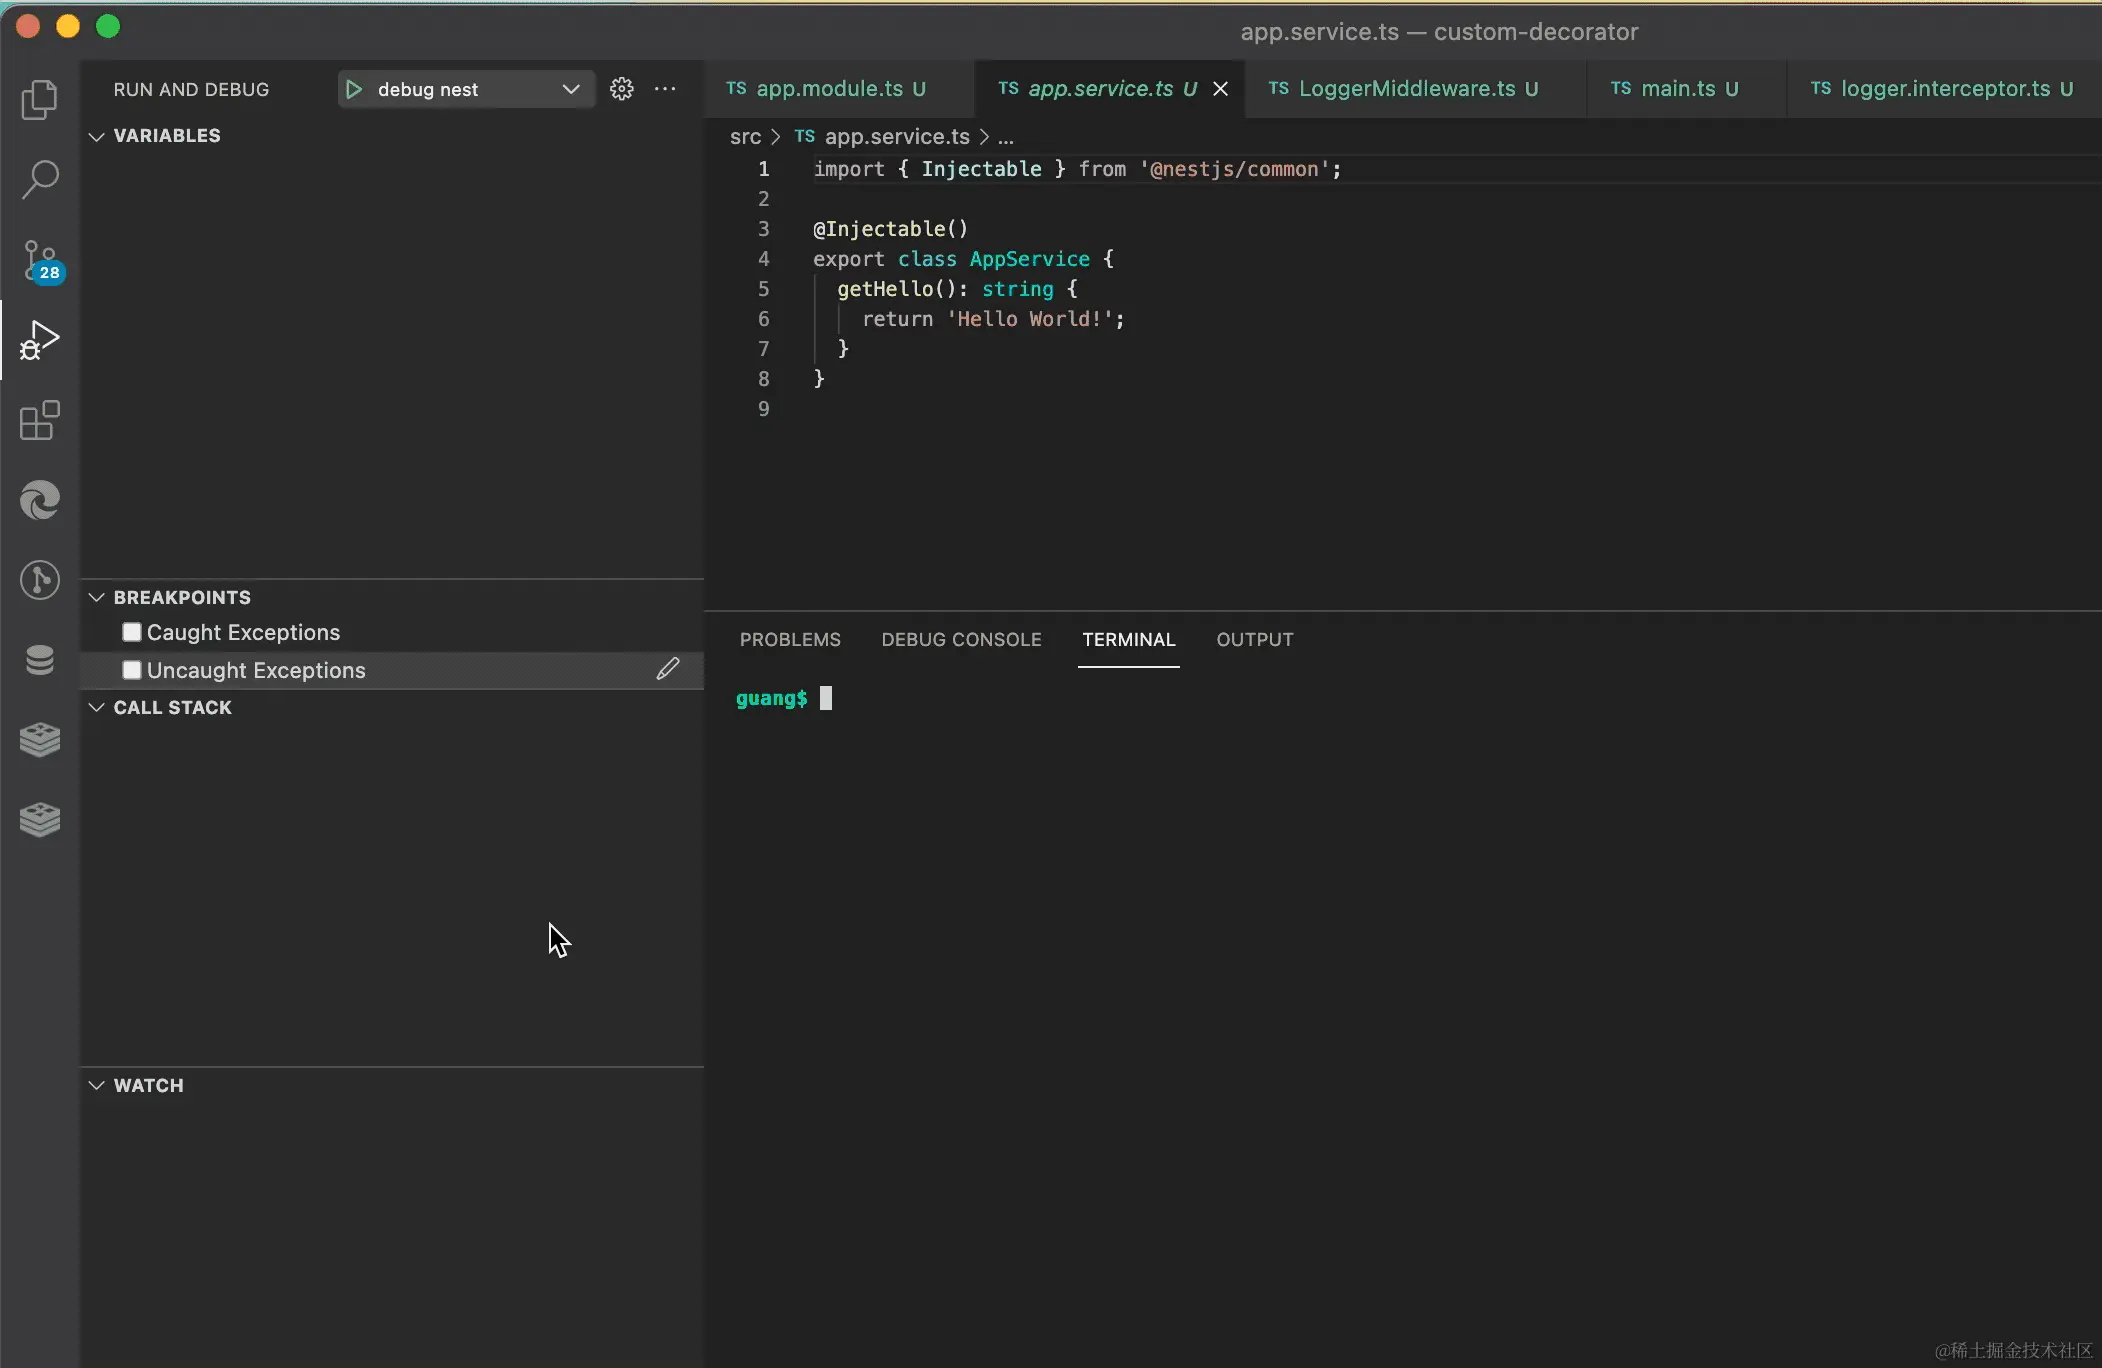
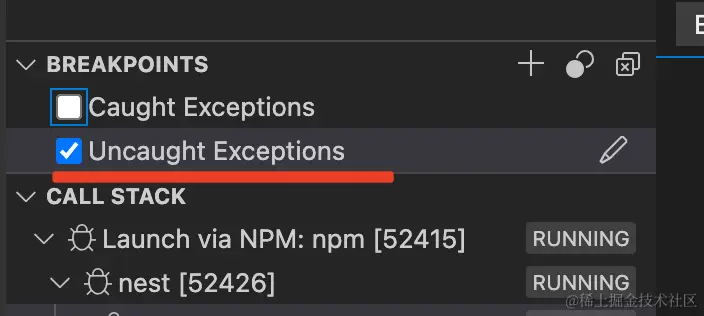
3.异常断点 Uncaught Exceptions
在没有处理的异常处自动断住
其他
node 代码可以加上 --inspect 或者 --inspect-brk 启动调试 ws 服务,然后,用 Chrome DevTools
或者 vscode debugger 连上来调试。
nest 项目的调试也是 node 调试,可以用 nest start --debug 启动 ws 服务,然后,在 vscode 里
attach 上了调试,也可以添加一个调试配置来运行 npm run start:dev。
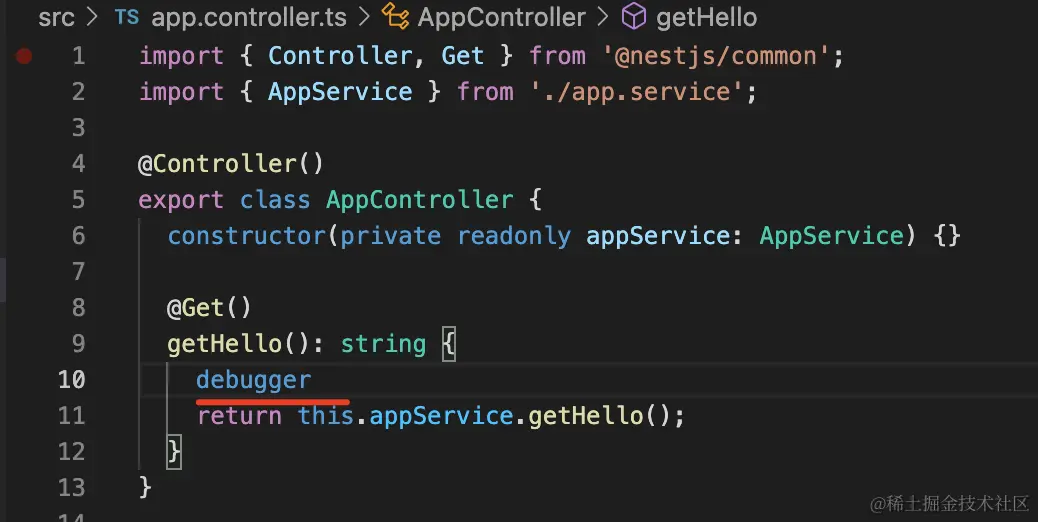
因为 –inspect 并不会和 –inspect-brk 一样在首行断住。加个 debugger